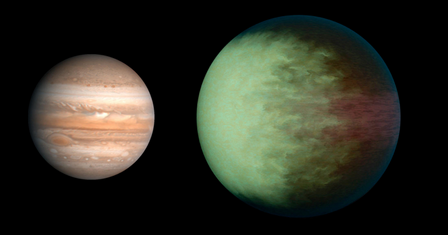
Kepler-7b
In our previous looks at mapping extrasolar planets, we have focused on spatial variations in infrared brightness, and thus temperature, on the visible surface of extrasolar gas giant planets. The reason for this bias toward longer wavelengths is two-fold: 1) At the time, Spitzer phase curve photometry has been the dominant means of deriving crude longitudinal maps of extrasolar planets. 2) The ratio between the flux from the star and the planet is an order of magnitude less in infrared than it is in visible light – also the reason that the successes from direct imaging of extrasolar planets have been almost exclusively in infrared (the nature of the object imaged at Fomalhaut by HST in visible is unknown). Short-period extrasolar planets are thus prime candidates for secondary eclipse observations in the infrared. The following table lists several prominent planets and the eclipse depths as measured in four infrared channels by Spitzer, known as the IRAC channels (Infrared Array Camera) which have been a cornerstone of the building up of the foundation of our understanding about extrasolar planets in the past decade.
| Spitzer IRAC Eclipse Depths | ||||
| Planet | 3.6µm | 4.5µm | 5.8µm | 8.0µm |
| HAT-P-7 Ab | 0.098% | 0.159% | 0.245% | 0.225% |
| Kepler-5 b | 0.103% | 0.107% | – | – |
| Kepler-6 b | 0.069% | 0.151% | – | – |
| HD 189733 b | 0.256% | 0.214% | 0.310% | 0.391% |
| HD 209458 b | 0.094% | 0.213% | 0.301% | 0.240% |
Of course the eclipse depth of a planet depends on its intrinsic brightness at the observed wavelength, the brightness of the star itself, and the radius ratio between the two, and given the comparitive brightness and size of a star, it is not hard to see why the drop in flux from the system during the planet’s eclipse behind the star would be so miniscule, < 1%.
The difficulty involved is exaggerated in visible wavelengths, where the flux is dominated less by thermal emission of the two bodies and more by intrinsic processes within the star and how reflective the planet is of the star’s light. Here are some secondary eclipse depth measurements from Kepler, which observes in a filter that is approximately visible light (0.400 – 0.865µm).
| Kepler Eclipse Depths | |
| Planet | ΔF |
| HAT-P-7 Ab | 0.0069% |
| Kepler-5 b | 0.0021% |
| Kepler-6 b | 0.0022% |
| Kepler-7 b | 0.0042% |
| Kepler-12 b | 0.0031% |
Notice that the eclipse depths in visible light are much lower than the eclipse measurements in infrared. For planets with both Spitzer (infrared) and Kepler (visible light) eclipse depth measurements, the contrast is clear: the star-planet brightness ratio is less in infrared than it is in visible light and therefore hot Jupiters are essentially relatively brighter in infrared than in visible.
This does not exclude extrasolar planets from visible light mapping using the phase curve analysis and eclipse scanning techniques described before, it only makes it harder. Optical phase curves are weaker than infrared phase curves, so either a bigger telescope is needed to observe with enough photometric precision to resolve the phase curve in one orbit, or several orbits must be observed with existing instrumentation and allow the data to build up until a phase curve can be resolved.
Fortunately, Kepler has offered quasi-continuous coverage of the transits of many hot Jupiters over the course of four years, and in some cases, it is enough to confidently detect a phase curve. One such planet is Kepler-7 b.

Kepler-7b Phase_Curve
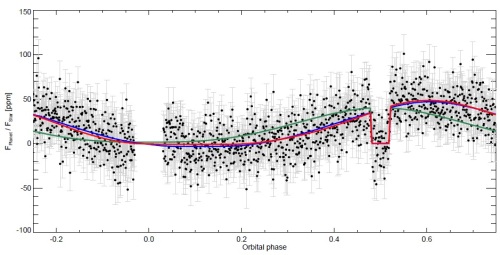
In this image, the green curve corresponds to the expected phase curve if the planet reflected light in a geometrically symmetric way. The red and blue curves are fitted to the data and incorporate a longitudinal offset (see Demory et al for details). The primary transit is on the left side, and the planet passes behind the star on the left side (the secondary eclipse). The depth of the primary transit is so deep on this scale that it is off the image. Notice that the phase curve is not perfectly phased to the orbit of the planet – the secondary eclipse does not occur at the peak apparent brightness. This would be comparable to the Moon being brightest not when it is full, but rather at a gibbous phase. Keep in mind that this is an optical phase curve, the brightness variations on the planet’s dayside hemisphere suggested by the phase curve corresponds to actual features you would be able to see with the human eye (and maybe a welding helmet).
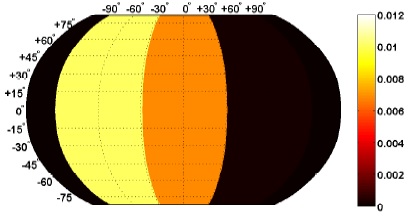
The Kepler-7 b phase curve shows us that the brightest part of the planet’s dayside atmosphere is on the westward side of the dayside hemisphere. Because this phase curve is an accumulation of 14 quarters of Kepler data, it is best thought of as an “average” phase curve over the course of 3.5 years, and therefore the longitudinally resolved visible light map of the planet is an average of the planet’s surface brightness over 3.5 years. Since the planet does not contribute to the phase curve of the system during secondary eclipse, the scatter of the data during that secondary eclipse is a good representative of the overall data scatter. It may come from instrumental noise or stellar noise, but whatever its origin, the fact that it is not obviously different from the scatter in the phase curve when the planet’s brightness is contributing implies that the surface features resolved here are both stable and long-lived.

Kepler-7b longitudinal brightness distribution
What could be the cause of this bright area on the planet? Demory et al explain:
Kepler-7b may be relatively more likely to show the effects of cloud opacity than other hot Jupiters. The planet’s incident flux level is such that model profiles cross silicate condensation curves in the upper, observable atmosphere, making these clouds a possible explanation. The same would not be true for warmer planets (where temperatures would be too hot for dayside clouds) or for cooler planets (where silicates would only be present in the deep, unobservable atmosphere). Furthermore, the planet’s very low surface gravity may play an important role in hampering sedimentation of particles out of the atmosphere.
Now how do we know that this bright spot is not simply due to thermal emission? Some hot Jupiters are sufficiently hot that the glow from their heat in visible light can affect, or even dominate their eclipse depths. The obvious answer would be to check Kepler-7 b’s eclipse depths in the infrared, and this is a job for Spitzer. Spitzer observed the secondary eclipse of Kepler-7 b in both 3.6 µm and 4.5 µm, and in both wavelengths, the eclipse of the planet behind the star was not confidently detected. This means that the planet isn’t just not hot enough to produce the brightness asymmetry in the Kepler phase curve, but it’s eclipse couldn’t even be confidently detected in infrared. This firmly rules out thermal emission as the source of the optical phase curve asymmetry.
This represents the first time that visible light “surface” features have been identified on an extrasolar planet. This is but a baby-step forward in our ability to map extrasolar planets, but it is a milestone nonetheless. Kepler data may be able to detect phase curve asymmetries in other hot Jupiter systems (or if we are lucky, smaller worlds!), and this can significantly contribute to our understanding of the atmospheres of these planets.